

Prediction model for coke quality and mechanism based on coking coal composition and structure parameters
-
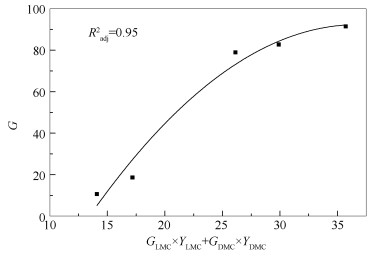
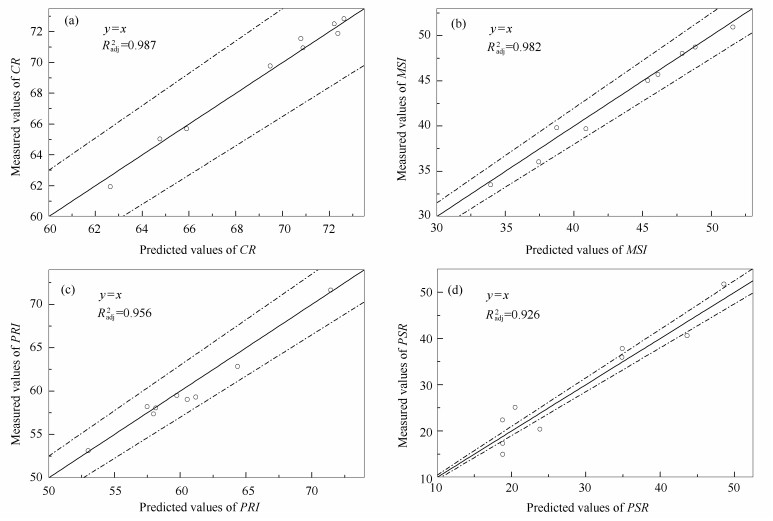
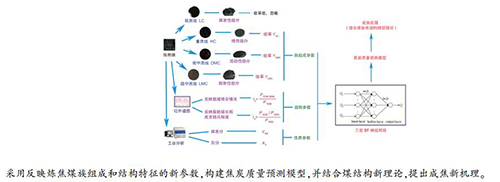
摘要: 以五种炼焦煤和44组配合煤为研究对象,在40 kg小焦炉环境下完成煤杯炼焦实验,以煤全组分分离所获得的煤重质组、密中质组和疏中质组收率YHC、YDMC、YLMC及反映煤中氢键缔合情况和脂肪链长短或支链化程度的红外光谱参数I3、I4为主要指标,通过BP神经网络分析方法建立了焦炭质量预测模型,并讨论了模型的特点,分析了新模型下的成焦机理。结果表明,使用新的煤组成结构参数预测焦炭质量具有一定优势,成焦率(CR)、显微强度(MSI)、粒焦反应性(PRI)和反应后强度(PSR)的预测值和实测值有较好一致性,对y=x的拟合相关系数分别达到0.986、0.982、0.956和0.926。模型对CR、MSI和PRI的预测效果较好,九个预测样本的平均偏差分别为0.53%、1.58%和1.28%;但对反应后强度PSR预测效果较差,平均偏差在12.22%。研究结果为建立炼焦配煤新方法提供了良好基础。Abstract: Five coking coals and 44 groups of blended coals were studied, and the coking experiments with coal cup were completed using a 40 kg small coke oven. According to the yields of heavy component, dense medium component and loose medium component (YHC, YDMC and YLMC) obtained by all-component separation as well as the FT-IR parameters of I3 and I4 which reflect hydrogen bond association, aliphatic chain length and branched degree, the prediction model for coke quality was established with the BP neural network. Then, the characteristics of the model were discussed and the coking mechanism by the new model was analyzed. The results show that using new defined coal structure parameters to predict coke quality has some advantages. The predicted and measured values of coke formation rate (CR), micro-strength (MSI), reactivity of particulate coke (PRI) and post-reaction strength (PSR) are in good agreement, and the fitting correlation coefficient of y versus x reaches 0.986, 0.982, 0.956 and 0.926, respectively. The prediction results of CR, MSI and PRI by the model are good with the mean variation of nine samples being 0.53%, 1.58% and 1.28%, respectively. However, the prediction result of (PSR) is poor with the mean variation being 12.22%. The results can provide a good foundation for the establishment of a new method for coal blending.
-
Key words:
- coal blending for coking /
- coke quality /
- prediction model /
- BP neural network /
- coking mechanism
-

图 1 配煤炼焦实验器具及所制备焦炭
(a), (b):coal cup; (c): briquette; (d): tableting; (e): muddler; (f): coke
Figure 1 Experimental apparatus for coking of blended coals and the obtained coke

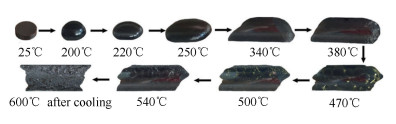
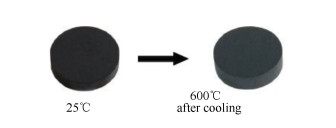
图 4 DMC压片在不同温度下的受热形态变化
Figure 4 Morphological evolution of DMC heating at different temperatures

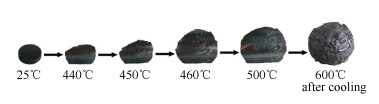
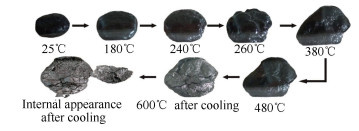
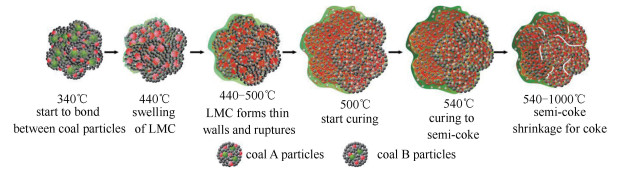
图 5 LMC压片在不同温度下的受热形态变化
Figure 5 Morphological evolution of LMC heating at different temperatures

图 6 HC压片在不同温度下的受热形态变化
Figure 6 Morphological evolution of HC heating at different temperatures

图 7 LC在不同温度下的受热形态变化
Figure 7 Morphological evolution of LC heating at different temperatures

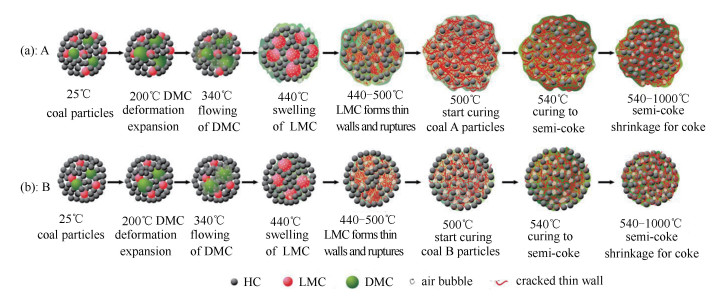
图 8 两种炼焦煤的成焦机理示意(煤颗粒内部)
Figure 8 Coking mechanism diagram of two kinds of coking coal (interior of coal particles)

图 9 单种煤成焦机理(炼焦煤A,煤颗粒间)
Figure 9 Coking mechanism diagram of single coal (between coal A particles)

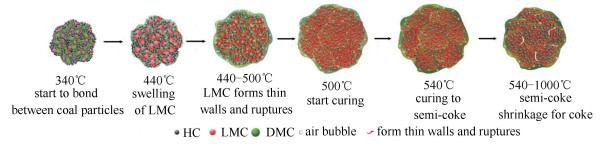
图 10 配合煤成焦机理(炼焦煤A与炼焦煤B颗粒间)
Figure 10 Coking mechanism diagram of blended coal (between coal A and coal B particles)
表 1 煤样的工业分析和元素分析
Table 1 Proximate and ultimate analyses of coal samples
Coal sample Proximate analysis w/% Ultimate analysis wdaf /% Mad Ad Vdaf FCdaf C H O* N S XL 1.34 7.60 27.65 72.35 87.52 5.37 3.40 1.50 2.21 BL 0.82 8.95 32.67 67.33 86.52 5.52 5.54 1.61 0.81 YC 0.68 8.69 37.13 62.87 86.24 6.06 5.09 1.63 0.98 JX 1.90 11.16 36.21 63.79 84.25 6.08 7.25 1.68 0.74 TY 1.26 10.05 33.86 66.14 83.15 5.55 8.54 1.62 1.14 *:by difference  下载: 导出CSV
表 2 全组分分离后各族组分收率
Table 2 Yield of each group component after separation of all components
Sample wdaf /% YDMC YLMC YHC YLC ΔL XL 11.46 20.48 65.33 0.71 2.02 BL 9.00 20.66 67.62 1.09 1.63 YC 11.94 26.79 59.15 1.27 0.85 JX 8.21 12.10 77.52 0.88 1.29 TY 5.65 12.59 79.38 1.29 1.09 ΔL:amount at stake
下载: 导出CSV
表 3 炼焦实验用煤样配比
Table 3 Ratio of each coal sample for coking experiment
No. Ratio /% XL YC BL JX TY 1 100 - - - - 2 - 100 - - - 3 - - 100 - - 4 - - - 100 - 5 - - - - 100 6 81.83 - - 18.17 - 7 66.5 - - 33.5 - 8 51.18 - - 48.82 - 9 43.52 - - 56.48 - 10 28.19 - - 71.81 - 11 12.87 - - 87.13 - 12 84.42 - - - 15.58 13 71.28 - - - 28.72 14 58.15 - - - 41.85 15 51.58 - - - 48.42 16 38.44 - - - 61.56 17 25.31 - - - 74.69 18 14.29 - - - 85.71 19 - 80.38 19.62 - - 20 - 67.6 32.4 - - 21 - 54.81 45.19 - - 22 - 42.03 57.97 - - 23 - 29.25 70.75 - - 24 - 19.28 80.72 - - 25 - 86.08 - 13.92 - 26 - 69.61 - 30.39 - 27 - 53.14 - 46.86 - 28 - 36.67 - 63.33 - 29 - 25.69 - 74.31 - 30 - 14.71 - 85.29 - 31 - 87.57 - - 12.43 32 - 72.85 - - 27.15 33 - 58.14 - - 41.86 34 - 43.42 - - 56.58 35 - 33.61 - - 66.39 36 - 23.8 - - 76.2 37 - 13.99 - - 86.01 38 - - 83.53 16.47 - 39 - - 73.9 26.1 - 40 - - 64.28 35.72 - 41 - - 45.03 54.97 - 42 - - 27.07 72.93 - 43 - - 6.54 93.46 - 44 - - 86.37 - 13.63 45 - - 70.46 - 29.54 46 - - 54.54 - 45.46 47 - - 38.62 - 61.38 48 - - 22.71 - 77.29 49 - - 14.75 - 85.25
下载: 导出CSV
表 4 焦炭性能
Table 4 Coke performances
No. CR/% MSI/% PRI/% PSR/% 1 71.98 48.28 61.16 21.88 2 54.94 27.93 57.5 23.15 3 66.15 49.8 58.8 17.51 4 67.31 47.51 59.79 44.64 5 70.4 43.56 60.87 44.77 6 72.93 45.21 57.35 33.65 7 72.5 45.03 58.06 35.96 8 71.48 51.81 56.94 45.59 9 70.94 50.95 59.03 37.81 10 70.26 50.73 61.85 31.61 11 69.45 43.53 62.55 37.49 12 71.42 40.48 65.07 27.5 13 72.84 43.74 62.65 29.56 14 72.83 45.7 53.13 51.78 15 72.63 41.63 63 28.26 16 71.94 47.3 55.37 46.54 17 72.36 50.44 65 32.41 18 70.92 41.85 66.13 28.68 19 55.77 30.18 60.13 15.35 20 64.04 38.43 60.35 20.78 21 61.71 41.42 52.6 34.37 22 65.7 36.04 58.2 17.3 23 65.03 39.81 57.35 14.97 24 62.86 33.89 61.56 39.04 25 61.93 33.51 59.5 22.37 26 65.51 38.06 52.25 49.98 27 67.2 51.77 56.05 52.9 28 67.58 46.21 57.63 46.96 29 66.71 46.47 60.3 40.7 30 67.63 46.89 59.15 42.29 31 57.86 37.37 61.97 15.94 32 63.64 44.97 62.8 13.16 33 68.82 50.96 60.92 23.95 34 69.93 44.23 63.72 21.55 35 69.26 42.33 63.4 31.02 36 70.28 39.37 67.37 23.1 37 71.88 39.71 71.66 20.4 38 69.6 45.24 57.9 26.35 39 69.27 44.28 61.46 16.76 40 68.65 49.76 58.22 30.51 41 69.82 50.4 60.1 30.56 42 69.77 48.02 59.32 40.63 43 69.92 42.64 63.05 34.02 44 68.35 44.3 60.95 20.13 45 71.55 48.73 62.84 25.12 46 73.31 49.32 63.12 30.4 47 71.91 41.33 67 17.87 48 72.45 40.52 73.08 15.3 49 71.92 41.26 69.93 19.46
下载: 导出CSV
表 5 配合煤的质量参数
Table 5 Quality parameters for blended coals
No. Quality parameters for blended coals YDMC/% YLMC/% YHC/% Vdaf/% Ad/% I3 I4 1 11.46 20.48 65.33 27.65 7.60 22.69 2.61 2 11.94 26.79 59.15 37.13 8.69 15.03 2.15 3 9.00 19.66 63.62 32.67 8.95 18.66 2.63 4 8.21 12.1 77.52 36.21 11.16 16.97 3.13 5 5.65 12.59 79.38 33.86 10.05 5.86 2.95 6 10.87 18.96 67.55 20.44 8.25 21.65 2.61 7 10.37 17.67 69.41 21.36 8.79 20.77 2.62 8 9.87 16.39 71.28 22.28 9.34 19.90 2.62 9 9.62 15.75 72.22 22.74 9.61 19.46 2.62 10 9.13 14.46 74.08 23.66 10.16 18.58 2.62 11 8.63 13.18 75.95 24.58 10.70 17.71 2.63 12 10.55 19.25 67.52 20.03 7.98 20.07 2.66 13 9.79 18.21 69.37 20.60 8.30 17.86 2.71 14 9.03 17.18 71.21 21.17 8.63 15.65 2.75 15 8.65 16.66 72.13 21.46 8.79 14.54 2.77 16 7.88 15.62 73.98 22.03 9.11 12.33 2.82 17 7.12 14.59 75.82 22.60 9.43 10.12 2.86 18 10.55 19.25 67.52 23.08 9.70 8.26 2.90 19 11.36 25.39 60.03 25.38 8.74 15.74 2.24 20 10.99 24.48 60.60 24.98 8.77 16.21 2.31 21 10.61 23.57 61.17 24.58 8.81 16.67 2.37 22 10.24 22.66 61.74 24.18 8.84 17.13 2.43 23 9.86 21.75 62.31 23.78 8.87 17.60 2.49 24 9.57 21.03 62.76 23.47 8.90 17.96 2.54 25 11.42 24.67 61.71 25.90 9.03 21.89 2.29 26 10.81 22.17 64.73 25.80 9.44 20.95 2.45 27 10.19 19.67 67.76 25.69 9.85 20.01 2.61 28 9.58 17.16 70.78 25.58 10.25 19.07 2.77 29 9.17 15.50 72.80 25.51 10.53 18.44 2.88 30 8.76 13.83 74.82 25.44 10.80 17.81 2.99 31 11.16 25.02 61.66 25.71 8.86 13.89 2.25 32 10.23 22.93 64.64 25.37 9.06 12.54 2.37 33 9.31 20.85 67.62 25.03 9.26 11.19 2.48 34 8.38 18.76 70.60 24.70 9.46 9.84 2.60 35 7.76 17.36 72.58 24.47 9.59 8.94 2.68 36 7.15 15.97 74.57 24.25 9.73 8.04 2.76 37 6.53 14.58 76.55 24.02 9.86 7.13 2.84 38 8.87 18.41 65.91 23.28 9.31 18.38 2.71 39 8.79 17.69 67.25 23.52 9.53 18.22 2.76 40 8.72 16.96 68.59 23.75 9.74 18.06 2.81 41 8.57 15.50 71.26 24.23 10.16 17.73 2.90 42 8.42 14.15 73.76 24.68 10.56 17.43 2.99 43 8.26 12.59 76.61 25.18 11.02 17.08 3.10 44 8.54 19.56 69.22 22.98 9.10 16.92 2.67 45 8.01 18.28 71.09 23.12 9.27 14.88 2.72 46 7.48 16.99 72.97 23.25 9.45 12.84 2.78 47 6.94 15.71 74.84 23.38 9.63 10.80 2.83 48 6.41 14.42 76.71 23.51 9.80 8.77 2.88 49 6.14 13.78 77.65 23.58 9.89 7.75 2.90
下载: 导出CSV
表 6 焦炭质量实验值与预测值的比较
Table 6 Comparison of measured and predicted values for coke quality
No. CR MSI PRI PSR measured prediction measured prediction measured prediction measured prediction deviation /% deviation /% deviation /% deviation /% 41 65.70 65.90 36.04 37.43 58.20 57.48 17.30 18.81 -0.30 3.86 1.24 -8.73 42 72.83 72.62 45.70 46.12 53.13 53.00 51.78 48.58 0.29 -0.92 0.24 6.18 43 72.50 72.21 45.03 45.38 58.06 58.13 35.96 34.85 0.40 -0.78 -0.12 3.09 44 61.93 62.63 33.51 33.95 59.50 59.75 22.37 18.78 -1.13 -1.31 -0.42 16.05 45 69.77 69.47 48.02 47.89 59.32 61.18 40.63 43.62 0.43 0.27 -3.14 -7.36 46 71.55 70.78 48.73 48.83 62.84 64.36 25.12 20.49 1.08 0.21 -2.42 18.43 47 70.94 70.88 50.95 51.57 59.03 60.54 37.81 34.91 0.08 1.22 -2.56 7.67 48 65.03 64.76 39.81 38.74 57.35 57.97 14.97 18.81 0.42 2.69 -1.08 -25.65 49 71.88 72.36 39.71 40.87 71.66 71.43 20.40 23.84 -0.67 2.92 0.32 -16.86 Mean deviation /% 0.53 1.58 1.28 12.22 Maximum deviation /% 1.13 3.86 3.14 25.65 a:deviation =(measured value-prediction value)/ measured value
下载: 导出CSV
表 7 不同允许相对误差下焦炭质量的命中率
Table 7 Hit rate of coke quality under different allowed relative errors
Allowed relative error /% CR hit rate /% MSI hit rate /% PRI hit rate /% PSR hit rate /% 10 100 100 100 55.56 5 100 100 100 11.11 4 100 100 100 11.11 3 100 88.89 88.89 0 2 100 66.67 66.67 0
下载: 导出CSV
-
[1] 谢海深, 刘永新, 吕庆, 孟军波.焦炭质量预测模型[J].东北大学学报(自然科学版), 2007, 28(3):373-377. doi: 10.3321/j.issn:1005-3026.2007.03.018XIE Hai-shen, LIU Yong-xin, LÜ Qing, MENG Jun-po. Coke quality prediction models[J]. J Northeast Univ, 2007, 28(3):373-377. doi: 10.3321/j.issn:1005-3026.2007.03.018 [2] DÍEZ M A, ALVAREZ R, BARRIOCANAL C. Coal for metallurgical coke production:Predictions of coke quality and future requirements for cokemaking[J]. Int J Coal Geol, 2002, 50(1/4):389-412. http://www.sciencedirect.com/science/article/pii/S0166516202001234 [3] ZHANG Q, WU X, FENG A, SHI M. Prediction of coke quality at Baosteel[J]. FPT, 2004, 86(1):1-11. http://www.sciencedirect.com/science/article/pii/S0378382003000584 [4] ÁLVAREZ R, DÍEZ M A, BARRIOCANAL C, DÍAZ-FAES E, CIMADEVILLA J L G. An approach to blast furnace coke quality prediction[J]. Fuel, 2007, 86(14):2159-2166. doi: 10.1016/j.fuel.2006.11.026 [5] MORGA R, JELONEK I, KRUSZEWSKA K, SZULIK W. Relationships between quality of coals, resulting cokes, and micro-Raman spectral characteristics of these cokes[J]. Int J Coal Geol, 2015, 144/145:130-137. doi: 10.1016/j.coal.2015.04.006 [6] CHEHREH C S, MATIN S S, HOWER J C. Explaining relationships between coke quality index and coal properties by Random Forest method[J]. Fuel, 2016, 182:754-760. doi: 10.1016/j.fuel.2016.06.034 [7] YU A B, STANDISH N, LU L. Coal agglomeration and its effect on bulk density[J]. Powder Technol, 1995, 82(2):177-189. doi: 10.1016/0032-5910(94)02912-8 [8] NOMURA S, THOMAS K M. The effect of swelling pressure during coal carbonization on coke porosity[J]. Fuel, 1996, 75(2):187-194. doi: 10.1016/0016-2361(95)00238-3 [9] 张群, 吴信慈, 冯安祖, 史美仁.宝钢焦炭质量预测模型Ⅱ.焦炭质量预测模型的建立和应用[J].燃料化学学报, 2002, 30(4):300-305. doi: 10.3969/j.issn.0253-2409.2002.04.003ZHANG Qun, WU Xin-ci, FENG An-zu, SHI Mei-ren. Baosteel coke quality prediction model Ⅱ. Establishment and application of coke quality[J]. J Fuel Chem Technol, 2002, 30(4):300-305. doi: 10.3969/j.issn.0253-2409.2002.04.003 [10] 王光辉, 范程, 田文中, 余明程, 刘智平, 潘立慧, 靳美程.焦炭质量预测方法的研究[J].武汉科技大学学报(自然科学版), 2007, 30(1):37-40. doi: 10.3969/j.issn.1674-3644.2007.01.011WANG Guang-hui, FAN Cheng, TIAN Wen-zhong, YU Ming-cheng, LIU Zhi-ping, PAN Li-hui, JING Mei-cheng. Method for prediction of coke quality[J]. J Wuhan Univ Sci Technol (Nat Sci Edi), 2007, 30(1):37-40. doi: 10.3969/j.issn.1674-3644.2007.01.011 [11] 吕桂双, 郑美荣, 赵华, 陈友.焦炭反应性、反应后强度影响因素的研究探讨[C].全国炼铁生产技术会议暨炼铁学术年会, 2009.LÜ Gui-shuang, ZHENG Mei-rong, ZHAO Hua, CHEN You. The effect study of coking coal qualities on coke thermal property[C]. CSST, 2009. [12] 周师庸.应用煤岩学[M].北京:冶金工业出版社, 1985.ZHOU Shi-yong. The Applation of Coal Petrology[M]. Beijing:Metall Ind Press, 1985. [13] 周师庸, 赵俊国.冶金工业出版社, 2005.ZHOU Shi-yong, ZHAO Jun-guo. Beijing:Metall Ind Press, 2005. [14] 杨建刚.人工神经网络实用教程[M].杭州:浙江大学出版社, 2001.YANG Jian-gang. The Practical Tutorial of Artificial Neural Network[M]. Hangzhou:Zhejiang University Press, 2001. [15] 周洪, 闵礼书, 邹祥林.基于神经网络的特大型焦炉焦炭质量预测研究[J].系统仿真学报, 2009, 21(6):1543-1547. http://d.old.wanfangdata.com.cn/Periodical/xtfzxb200906011ZHOU Hong, MIN Li-shu, ZOU Xiang-lin. Reserach on prediction of blended coal for coking in oversized coke furnance based on neural network[J]. J Syst Simul, 2009, 21(6):1543-1547. http://d.old.wanfangdata.com.cn/Periodical/xtfzxb200906011 [16] 刘俊, 张学东, 刘宏, 徐海平.基于BP神经网络的焦炭质量预测[J].燃料与化工, 2006, 37(6):12-15. doi: 10.3969/j.issn.1001-3709.2006.06.004LIU Jun, ZHANG Xue-dong, LIU Hong, XU Hai-ping. Prediction of coke quality based on BP neural network[J]. Fuel Chem Process, 2006, 37(6):12-15. doi: 10.3969/j.issn.1001-3709.2006.06.004 [17] 姜静, 宫春晖.神经网络在焦炭质量预测模型中的应用[J].沈阳理工大学学报, 2013, 32(2):25-27. doi: 10.3969/j.issn.1003-1251.2013.02.006JIANG Jing, GONG Chun-hui. A Quality Prediction Model of Coke Based on Neural Networks[J]. J Shenyang Univ Sci Technol, 2013, 32(2):25-27. doi: 10.3969/j.issn.1003-1251.2013.02.006 [18] 秦志宏, 李兴顺, 陈娟, 张丽英, 侯翠利, 巩涛.煤的黏结性来源及形成机理[J].中国矿业大学学报, 2010, 39(1):64-69. doi: 10.3969/j.issn.1009-105X.2010.01.013QIN Zhi-hong, LI Xing-shun, CHEN Juan, ZHANG Li-ying, HOU Cui-li, GONG Tao. Origin and formation mechanism of coal caking property[J]. J China Univ Min Technol, 2010, 39(1):64-69. doi: 10.3969/j.issn.1009-105X.2010.01.013 [19] 李祥, 秦志宏, 卜良辉, 杨状, 沈辰阳.炼焦煤的官能团结构分析及其黏结性产生机理[J].燃料化学学报, 2016, 44(4):385-393. doi: 10.3969/j.issn.0253-2409.2016.04.001LI Xiang, QIN Zhi-hong, BU Liang-hui, YANG Zhuang, SHEN Chen-yang. Structural analysis of functional group and mechanism investigation of caking property of coking coal[J]. J Fuel Chem Technol, 2016, 44(4):385-393. doi: 10.3969/j.issn.0253-2409.2016.04.001 [20] QIN Z, HOU C, CHEN J, ZHANG L, MA J. Group separation of coal components and new ideas of coal utilization as petroleum[J]. Int J Min Technol, 2009, 19(5):636-641. http://www.cnki.com.cn/Article/CJFDTotal-ZHKD200905016.htm [21] QI X, WANG D, XIN H, QI G. In situ FTIR study of real-time changes of active groups during oxygen-free reaction of coal[J]. Energy Fuels, 2013, 27(6):3130-3136. doi: 10.1021/ef400534f [22] 孙章, 郭瑞, 刘朋飞, 梁英华.粒焦动态反应性与块焦反应性关系的研究[J].煤炭转化, 2015, 38(3):70-73. doi: 10.3969/j.issn.1004-4248.2015.03.015SUN Zhang, GUO Rui, LIU Peng-fei, LIANG Ying-hua. Relationship between dynamic reactivity of particulate coke and lump coke reactivity[J]. Coal Convers, 2015, 38(3):70-73. doi: 10.3969/j.issn.1004-4248.2015.03.015 [23] 杨俊和, 杜鹤桂, 钱湛芬, 崔平.焦炭的粒焦反应性[J].东北大学学报, 1999, 20(3):64-67. http://d.old.wanfangdata.com.cn/Periodical/dbdxxb199903018YANG Jun-he, DU He-gui, QIAN Zhan-fen, CUI Ping. Reactivity of particulate coke[J]. J Northeast Univ, 1999, 20(3):64-67. http://d.old.wanfangdata.com.cn/Periodical/dbdxxb199903018 [24] PRICE J T, KHAN M A, GRANSDEN J F. "Suppercoke" high strength coke from western Canadian coals[C]. 59th Ironmaking Conference Proceedings. Chicago, Illinois, 1999: 227-239. [25] 张群, 吴信慈, 冯安祖, 史美仁.宝钢焦炭质量预测模型Ⅰ.影响焦炭热性质的因素[J].燃料化学学报, 2002, 30(2):113-118. doi: 10.3969/j.issn.0253-2409.2002.02.004ZHANG Qun, WU Xin-ci, FENG An-zu, SHI Mei-ren. Baosteel coke quality prediction model Ⅰ. Factors affecting thermal properties of coke[J]. J Fuel Chem Technol, 2002, 30(2):113-118. doi: 10.3969/j.issn.0253-2409.2002.02.004 [26] QIN Z, LI X, SUN H, ZHAO C, RONG L. Caking property and active components of coal based on group component separation[J]. Int J Min Technol, 2016, 26(4):571-575. doi: 10.1016/j.ijmst.2016.05.006 [27] 张双全.煤化学[M].徐州:中国矿业大学出版社, 2009.ZHANG Shuang-quan. Coal Chemistry[M]. Xuzhou:China University of Mining Technology Press, 2009. [28] 翁诗甫.傅里叶变换红外光谱仪[M].化学工业出版社, 2005.WENG Shi-fu. Fourier Transform Infrared Spectrometer[M]. Beijing:Chemical Industry Press, 2005. [29] 张德丰. MATLAB神经网络应用设计[M].北京:机械工业出版社, 2009.ZHANG Deng-feng. The Application of MATLAB in Design of Neural Networks[M]. Beijing:China Mechine Press, 2009. [30] 王秀坤, 张晓峰.用一组单输出的子网络代替多输出的BP网络[J].计算机科学, 2001, 28(10):61-63. doi: 10.3969/j.issn.1002-137X.2001.10.014WANG Xiu-kun, ZHANG Xiao-feng. A new architecture of neural network array replacing of a multiple outputs BP model networks[J]. Comput Sci, 2001, 28(10):61-63. doi: 10.3969/j.issn.1002-137X.2001.10.014 [31] 郭一楠, 王凌, 谭德健, 郝榕.基于遗传算法和神经网络混合优化的配煤控制[J].中国矿业大学学报, 2002, 31(5):404-406. doi: 10.3321/j.issn:1000-1964.2002.05.016GUO Yi-nan, WANG Ling, TAN De-jian, HAO Rong. Coal blending control based on mixed optimization of genetic algorithm and neural network[J]. J China Univ Min Technol, 2002, 31(5):404-406. doi: 10.3321/j.issn:1000-1964.2002.05.016 [32] 胡德生, 吴信慈, 戴朝发.宝钢焦炭强度预测和配煤煤质控制[J].宝钢技术, 2000(3):30-34. http://www.wanfangdata.com.cn/details/detail.do?_type=perio&id=QK200000667533HU De-sheng, WU Xin-ci, DAI Chao-fa. Coke strength prediction and the quality control of coal blending at Baosteel[J]. Baosteel Technol, 2000(3):30-34. http://www.wanfangdata.com.cn/details/detail.do?_type=perio&id=QK200000667533 [33] GOSICINSKI J S, GRAY R J, ROBINSON J W. A review of American coal quality and its effects on coke reactivity and after reaction strength of cokes[J]. J Coal Quality, 1985, 4(2):35-43; 4(4):21-29. [34] VALIA H S. Prediction of coke strength after reaction with CO2 from coal analyses at inland steel company[J]. I and SM, 1989, (5):77-87. [35] NOMURA S, NAITO M, YAMAGUCHI K. Post-reaction strength of catalyst-added highly reaction coke[J]. lSIJ Int, 2007, 47(6):831-839. http://www.wanfangdata.com.cn/details/detail.do?_type=perio&id=04058a4d67ae12b690f5ad290df4fd5b [36] 秦志宏.煤嵌布结构模型理论[J].中国矿业大学学报, 2017, 46(5):939-958. http://d.old.wanfangdata.com.cn/Periodical/zgkydxxb201705001QIN Zhi-hong. Theory on embedded structure model of coal[J]. J China Univ Min Technol, 2017, 46(5):939-958. http://d.old.wanfangdata.com.cn/Periodical/zgkydxxb201705001 -


 点击查看大图
计量
- 文章访问数: 300
- HTML全文浏览量: 112
- PDF下载量: 32
- 被引次数: 0
